- Research
- Open access
- Published:
The determinants of crop yields in Uganda: what is the role of climatic and non-climatic factors?
Agriculture & Food Security volume 7, Article number: 10 (2018)
Abstract
Background
It is widely accepted that crop yields will be affected by climate change. However, the role played by climate in affecting crop yields vis-a-vis non-climatic stresses, is often unclear, limiting decision choices around efforts to promote increased production in light of multiple stresses.
Results
This study quantifies the role of climatic and non-climatic factors affecting multiple crop yields in Uganda, utilizing a systematic approach which involves the use of a two-stage multiple linear regression to identify and characterize the most important drivers of crop yield, examine the location of the key drivers, identify the socio-economic implications of the drivers and identify policy options to enhance agricultural production. We find that non-climatic drivers of crop yields such as forest area dynamics (p = 0.012), wood fuel (p = 0.032) and usage of tractors (0.041) are more important determinants of crop yields than climatic drivers such as precipitation, temperature and CO2 emissions from forest clearance. Climatic drivers are found to multiply existing risks facing production, the significance of which is determined by variability and inadequate distribution of precipitation over the crop growing seasons.
Conclusion
The significance and validity of these results is observed in an f-statistic of 50 for the final optimized model when compared to the initial model with an f-statistic of 19.3. Research and agricultural policies have to be streamlined to include not only the climatic elements but also the non-climatic drivers of global, regional and national agricultural systems.
Background
Increasing global population, changes in consumption patterns and dietary needs and a rising demand for green energies has triggered a global need for increased food production. It is estimated that one in seven people lack access to food or are faced by malnutrition caused by poverty and rising food prices. Rising food prices caused by market speculations, expansion of crop cultivation to generate bioenergy and climate shocks are rendering the global food security problem even worse [1,2,3]. Even if these problems of access to food are solved, production would need to double to meet up with projected demand due to dietary changes and population growth [3,4,5,6,7,8,9,10]. Global food production will have to increase by ~ 70% to meet global food needs this century [1, 2, 11,12,13]. The task of feeding more people globally is even more daunting given global, regional and national patterns of climate and land use change [3, 7, 8, 10, 11, 14, 15].
Globally in general and in sub-Saharan Africa (SSA) in particular, agriculture is important in meeting dietary needs and underpinning economic growth. In Africa for example, about 50% of the gross domestic product (GDP) of most countries is from agriculture [16]. In most SSA countries, huge differentials exist between actual crop yields and projected yields mainly because production is often at subsistence levels [17]. The crop yield deficits recorded in most SSA countries are accentuated by climatic and non-climatic factors, including limited access to sufficient farm inputs such as tractors, unsustainable methods of cultivation, limited use of agroecology-related inputs and a significant climate variability [18, 19].
In Uganda, agriculture contributes about 20% to the GDP, 48% to export earnings, and employs about ~ 73% of the population [20]. In addition, more than 4 million Ugandan households depend on small-scale farming for their sustenance [20]. The pertinence of agriculture in Uganda is further seen as poverty reduction is tied to improvements in the agricultural sector [21, 22]. Agricultural systems in Uganda are highly sensitive to both land use and climatic conditions. However, it remains unclear which of the land use and climate-related drivers are most important in determining agricultural production. It has been argued, for instance, that the significance of changes in precipitation in affecting Ugandan crop yields is a function of variability and inadequate distribution of precipitation throughout the cropping seasons as opposed to the precipitation change per se [23]. Mubiru and Banda [24] added that due to frequent delays in precipitation during the March–May cropping season by close to 30 days, much of the precipitation that comes later (mid-April) is often not available for crops. It has also been argued that low agricultural productivity can be attributed to other non-climatic drivers such as limited use of external inputs, nutrient mining, soil erosion, deforestation, slash and burn cultivation inter alia as well as climate-related drivers such as precipitation, temperature and GHG emissions [24]. While multiple drivers affect crop yields in Uganda, the relative importance of different drivers is not well understood, constraining efforts to direct attention to the main impediments to maintaining and increasing crop yield in light of multiple stresses.
This study develops a systematic approach to identify and characterize the drivers of crop yields in Uganda. Identified key drivers are then used to determine specific policies that can enhance crop yields in light of multiple stresses. The work contributes to scholarship seeking to tease out the role of climate and non-climatic factors in affecting specific outcomes, with the approach developed having application to multiple contexts. To our knowledge, the study is the first to examine at a national level in Uganda the role of multiple factors in affecting crop yield.
Methods
Study area
Uganda is a SSA country located in East Africa (Fig. 1), and according to the 2013 census, Uganda has a population of ~ 36 million people [24]. Located within a humid equatorial region, prevailing winds and water bodies occasion differences in precipitation patterns. Mean annual precipitation ranges from 800 to 1500 mm. Precipitation is bimodal in the south (March–May and September–November) and unimodal in the north (April–October) [25, 26]. Though located close to the equator, Uganda’s climate is diverse due to the country’s unique biophysical characteristics influenced by large rivers, water bodies and mountain ranges to the east and west [25]. Variations in sea surface temperatures in the distant tropical pacific and Indian Oceans strongly influence the timing of annual precipitation in Uganda [25]. Northern Uganda experiences less precipitation than the south and is more susceptible to droughts [15, 25].

District-level map of Uganda
Theoretical approach and data acquisition
This study seeks to identify and characterize the relative contributions and importance of climatic and non-climatic variables (independent variables) in affecting crop yields (dependent variable) in Uganda using a systematic modelling approach. The study is based on national scale data of 10 non-climatic variables, 3 climatic variables and 1 dependent variable. The data points for each variable span a period of 53 years (1961–2014).
The dependent variable whose predictors this study attempts to determine is crop yield. Crop yield data were culled from the Food and Agricultural Organization’s department of Statistics-FAOSTAT [27]. A total of 31 food and cash crops (Additional file 1: Table S1) were aggregated to obtain the crop yield data per year in hectograms/hectare (Hg/Ha). However, the yield data were converted to tons/hectare (t/Ha) for standardization purposes. The rational of using several food and cash crops (31) as a representation of crop yields was based on:
-
The availability of complete time series data for all the 31 food and cash crops over the period 1961 and 2014.
-
The crops present a true picture of the crop yield scenarios of Uganda as they represent both arable and permanent crops.
-
The crops in question are crops whose production tallies are proportionate with the recognized crop growing seasons in Uganda for crops that grow all year round.
-
All the crop data were in the same units of measurement (Hg/Ha), as such comparisons and converting into (t/Ha) were easy to perform.
-
All the crops with available data were included to avoid the miss-representation that is often associated with using national scale growing season precipitation and temperature data over a single crop.
Climatic drivers were identified based on the availability of data and on the importance of climatic drivers in the growth of crops [28]. Adequate precipitation during the crop growing season as well as average annual precipitation and temperature enhances crop growth [29]. Since most of the 31 crops included in this study grow all year round, the mean annual precipitation and gridded temperature spanning the period 1961–2014 were used to fit the models. The use of crop growing season and mean annual precipitation and gridded temperature helps to capture the net effect of climate on all the crops used in this study as well as the differences in their sensitivities to changes in climate. This approach is necessary because different crops respond differently to different climatic stresses. Several studies have used a similar approach to verify the effects of climate change on several crops at a global, regional and country scale [9, 93,94,95]. For example, Lobell et al. [9] examined the effects of changes in climate based on growing season and annual precipitation and temperature at a global scale for the following crops: maize, wheat, soybeans and rice. Also, Sarker et al. [93] used regression models to examine the effects of climate change on three major rice crops: Aus, Aman and Boro in Bangladesh using mean growing season and mean annual temperature and total growing season and annual precipitation. Furthermore, a study by Lobell and Field [94] comes very close to this current study from a methodological perspective. The study developed statistical models of yield response to climate change at a global scale. The crops included rice, maize, soybeans, barley and sorghum. The study used gridded mean monthly/annual temperature and rainfall data for the period 1961–2002 to verify the effects of climate change on yields.
Atmospheric CO2 on the other hand may trigger higher temperatures and reduce precipitation or generally cause climate change in SSA and reduce crop yields [28]. An example here is found in a study by [96] which shows how interannual changes in CO2 emissions in Ethiopia have reduced agricultural productivity for major crops and livestock up to the baseline period of 2030. On the positive side, it has been argued that rising CO2 content in the atmosphere can enhance production if there is aerial fertilization which may trigger plant productivity, enhanced water management efficiency and reduced transpiration and ultimately increased crop productivity [28, 29]. This notwithstanding, it is generally difficult to investigate the effects of CO2 emissions on agricultural systems because of many uncertainties, quantitative estimates of CO2 emissions on agriculture are often of low confidence [97]. A major uncertainty is to be able to project changes in emissions and climate in the context of crop yields [97]. Ideally, long-term estimates of CO2 emissions covering the pre-industrial levels of 275 ppm and 2 °C increased warming at 550 ppm CO2 provide longer timescales over which the effects of CO2 emissions on crop yields can be computed with much certainty. The non-climatic drivers were selected based on the availability of data and on the argument that the outcome of crop yields is not only a function of climatic drivers but also due to land tenure systems [30,31,32]. Since it is still unclear which of these drivers determine crop yields the most, an experiment to verify this hypothesis was established in this study. Data on climatic and non-climatic drivers were sourced spanning the period 1961 to 2014.
The three independent climatic drivers are: precipitation, temperature and CO 2 emissions from forest clearance and are further described as follows:
-
Precipitation here represents mean annual precipitation (mm). The mean annual precipitation was used because the crops involved grow all year round and therefore their productivity is more affected by mean annual precipitation data. Specific crop growing season data are more appropriate when we consider crops like maize with shorter growing seasons. The mean annual precipitation data were culled from the collaborative 0.5° × 0.5° gridded crop growing season precipitation database of the University of Oxford and UNDP [33, 34].
-
The temperature data represent the mean annual temperatures (°C). Like precipitation, temperature data were culled from the collaborative 0.5° × 0.5° gridded crop growing season temperature database of the University of Oxford and UNDP [33, 34]. Again, mean annual temperatures were used because the crop involved grow all year round and therefore their productivity is more affected by mean annual temperature data.
-
The third climatic variable, annual CO 2 emissions from forest clearance in Uganda, represents the stock of annual CO2 emitted to the atmosphere due to deforestation or forest clearance (Houghton 1991); these data were collected from the Food and Agricultural Organization’s department of Statistics-FAOSTAT [27]. For a summary of the theoretical linkages between the climatic and non-climatic drivers, see Fig. 2.
Fig. 2 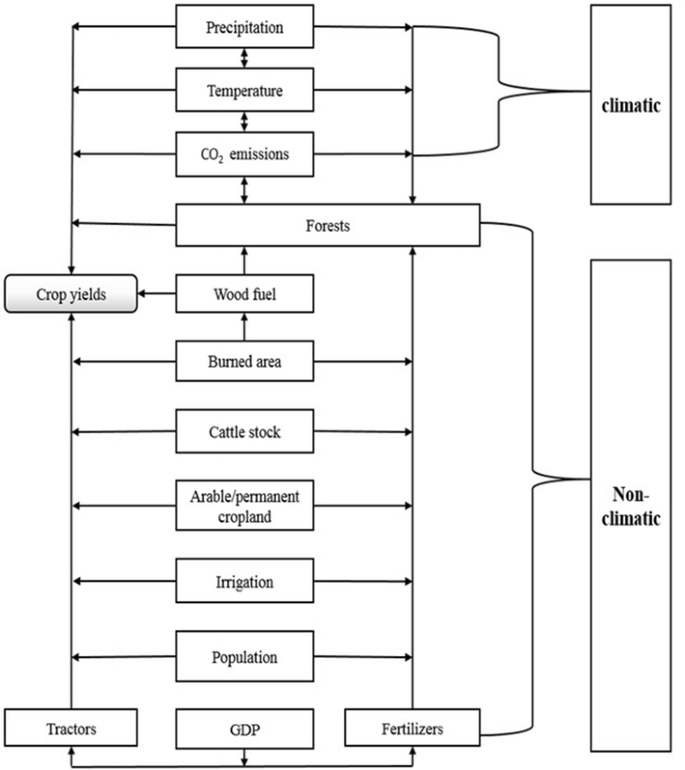
Schematic presentation of the linkages between the climatic and under climatic variables

The 10 independent non-climatic variables were culled from the Food and Agricultural Organization’s department of Statistics-FAOSTAT [27]. These 10 independent non-climatic variables have been described as being of very great importance in impacting crop yields in Africa [27]; they include:
-
Cattle stock This represents the total number of herds of cattle reared in Uganda. Usually, when cattle stock increases, this imposes reductions in crop yields because herds require land for grazing and in some cases herds of cattle affect yields by taking up land (for range land purposes), eating up crops and potentially occasioning farmer-grazier conflicts [35, 36].
-
Wood fuel This is the amount of wood extracted from the forest and used for energy purposes. Its unit of measurement is (m2). This reflects the total forest area lost due to wood fuel extraction. This variable often reduces crop yields when it entails destruction of forests associated with reduced forest carbon stock, reduced soil organic carbon (SOC) and nitrogen (SON) which are vital to crops [35,36,37].
-
Arable and permanent cropland This is the amount of land under temporal and permanent crops expressed in thousand hectares (K/Ha). The more this variable increases, the higher the yields in the short term and the lower the yields per Ha if agriculture is not mechanized in the long term. However, without mechanization of agriculture, this may not increase yields per Ha. Increasing crop yields in most of Africa is based on farmland expansion [35, 36]. However, with the prospects of getting more land becoming less feasible, relying on this option to increase crop yields is becoming a challenge [35,36,37].
-
The total area equipped for irrigation This is expressed in thousand hectares (K/Ha) and represents the farmlands that have access to irrigation facilities. In regions that are faced with problems of recurrent droughts as is the case of Uganda, irrigation facilities serve as safety nets that do sustain crop yields during periods of dryness.
-
Forest area This represents the amount of available forest expressed in thousand hectares (K/Ha). This variable often reduces crop yields when destruction of forests is associated with reduce forest carbon stock, reduced SOC and SON which are vital to crops [38].
-
Population This is the number of people who live in the country over time. This study used total population because population reflects total food needs of a country. Crop yields are influenced by both farming and non-farming populations. Normally, when the population growth is high, the food needs of the country are likely to be high, and this creates food security challenges if population growth fails to be matched by increased food production capacity [39]. Population here is therefore used to serve as a proxy for total food needs in the absence of total food needs data.
-
Gross domestic product (GDP) per capita This is expressed in millions and is an indicator used to gauge the health of the economy per head. It is the dollar value of all goods and services produced in Uganda over a specific period of time. A higher GDP has the potential to increase crop yields as most farmers will be able to access farm inputs.
-
Burned area This is expressed in hectares, and it is the total area of forest or grassland that is burnt and transformed into farmland. Burning is a common phenomenon in SSA, and it is used to create new farmlands and to provide ash that serves as a temporal source of nutrients to the soil. Normally, the more the burning, the more farmland is available, the more likely the increase in yields in the short term due to more land and ash from the burnt forests and grasslands [35].
-
Total fertilizers used This is expressed in tons. Fertilizers constitute a very important input into the agricultural system. When farmers have adequate access to fertilizers, their crop yields are likely to increase. However, in most SSA countries including Uganda, access to inorganic fertilizers is often limited by purchasing power because most of the farmers are poor. Organic fertilizers which are often free and agroecological and more sustainable have not been sufficiently valorized to levels at which they can sustain yields without inorganic fertilizers [40,41,42]. In this study, total fertilizers used entail both organic and inorganic fertilizers. Organic fertilizers include manure and compost, while inorganic fertilizers include chemical fertilizers such as nitrogen, potassium, phosphorus and magnesium fertilizers inter alia. In FAOSTAT (database from which data were culled), by simply selecting the options total organic and inorganic fertilizers, an excel sheet of the data for the years selected is obtained.
-
Agricultural tractors This represents the total number of agricultural tractors used. Tractors represent a very important input in any agricultural system, and the larger the number of tractors typically results in higher yields due to a faster and more efficient production process [43]. However, due to poverty, the majority of farmers in SSA who operate on predominantly small scale are unable to have access to such heavy capital inputs [43,44,45].
Analysis
We draw upon the systematic approach (SA) of Muller et al. [46] which is composed of a 4-step process for data analysis (Fig. 3).

Schematic representation of the key stages of our modified systematic approach
All 14 independent and dependent variables are subjected to detrending which removes all linear models of the actual time series by dividing the expected time series by the actual time series data. Detrending removes the effects of increased technology, shows annual variations and reduces the effects of inconsistent errors in reporting. For the equation used in determining the expected time series of all the 14 variables, see Eq. 1.
The first step of the systematic approach involves the use of a multiple linear regression approach (MLR) to identify the drivers of crop yields from among climatic and non-climatic variables. MLR provides the feedbacks between the dependent and independent variables through the t and p values which helps us to detect the level of importance of a given variable, and has been used in comparable contexts to this study, e.g. [47,48,49,50]. For the equations used in computing the initial model (IM) and the final optimized model (FOM) based on MLR see Eqs. 2 and 3 below.
where \({\text{EXP}}_{y}\) is the expected maize yield, χ is the year, a is the linear trend, b is the intercept when \({\text{EXP}}_{y} = ax\).
where \(Y_{\text{CYIM}}\) represents crop yields of the IM (dependent variable),\(Y_{\text{CYFOM}}\) represents crop yields of the FOM (dependent variable), \(\alpha_{0}\) is the regression intercept, \(\alpha_{1} X_{\text{PPT}}\) is the partial regression coefficient and mean annual precipitation, \(\alpha_{2} X_{\text{TEMP}}\) is the partial regression coefficient and mean annual temperature, \(\alpha_{3} X_{{{\text{CO}}_{2} }}\) is the partial regression coefficient and annual CO2 emissions from forest clearance, \(\alpha_{4} X_{\text{WF}}\) is the partial regression coefficient and wood fuel, \(\alpha_{5} X_{\text{CS}}\) is the partial regression coefficient and cattle stock, \(\alpha_{6} X_{\text{APC}}\) is the partial regression coefficient and arable and permanent cropland, \(\alpha_{7} X_{\text{IRRI}}\) is the partial regression coefficient and area equipped for irrigation, \(\alpha_{8} X_{\text{FA}}\) is the partial regression coefficient and forest area, \(\alpha_{9} X_{\text{POP}}\) is the partial regression coefficient and population, \(\alpha_{10} X_{\text{GDP}}\) is the partial regression coefficient and GDP, \(\alpha_{10} X_{\text{BA}}\) is the partial regression coefficient and burned area, \(\alpha_{11} X_{\text{FERT}}\) is the partial regression coefficient and total fertilizers used, and \(\alpha_{11} X_{\text{AGT}}\) is the partial regression coefficient and agricultural tractors.
The two-step regression is used because the initial regression model (IM) has weaknesses such as collinearity and inconsistent p and t values such that a second-stage regression analysis described herein as the final optimized model (FOM) is required to enhance the model and reduce the effects of the weaknesses of the IM on the FOM.
To optimize the IM, we sequentially removed all the ten other variables that did not make the list of the three most important variables and rerun the model. This process was repeated ten times until only the three most important variables remained (forest area, wood fuel and agricultural tractors). A model comprised of these three variables is then fitted to produce the FOM. To verify the importance of some of these drivers and to guide the analyses, the following hypotheses were established: the null hypothesis (H0) is that there is no difference in the impacts that all the climatic and non-climatic drivers/predictors have on crop yields. In other words, this means that both climatic and non-climatic drivers are of equal importance in terms of their relationship with crop yields. The alternate hypothesis (H1) states that some drivers/predictors of crop yields are more important than others. The model with the higher f-statistic is usually the more significant one.
Second, we examine the socio-economic aspects of the key drivers of crop yields in Uganda. The first part of this involves an examination of the population or organization involved with the drivers and the characteristics of the population involved in the operationalization of the drivers called agents. The second aspect of the socio-economic analysis involves the identification of the location or actual zones in the country where the drivers are dominant, a task which is similar to the spatial analysis. The third phase of the socio-economic analysis encompasses an identification of key products associated with any given driver. This is followed by an analysis of the methods of production of the products associated with the identified drivers and the markets where the products are sold (Table 3). The socio-economic analysis enables us to be able to understand in detail some of the more intricate issues behind the drivers that are often only specific to a given region.
Third, a detailed spatial analysis of the key drivers is carried out by identifying the various zones in the country where the different drivers are dominant. This enhances our understanding of where or answers the question, in what region or part of the country is a particular driver dominant. This phase is very similar to the location analysis carried out in the previous section.
The final phase of the approach involves a synthesis of stages one, two and three from which recommendations are made on possible context-specific policies that can be used to enhance crop yields in Uganda based on the drivers. With these, we proposed policies that are context specific and only in relation to the most important drivers of crop yields.
Results
Non-climatic factors are the main drivers of crop yields in Uganda
From the MLR simulations, the five most significant predictors/drivers of crop yields in Uganda do not encompass any climatic variable, and they are: forest area (t value: − 3.56), wood fuel (t value: − 3.44), GDP (t value: 2.82), tractors (t value: 2.92) and population (t value: − 1.55) (Table 1). This model has an f-statistic of 19.3 which indicates that the model is significant. This initial model (IM) is flawed however, by: (1) inconsistencies between the t and p values for most of the predictors and (2) extensive multicollinearity between some independent variables such as wood fuel, forest area and population.
Given these flaws, the IM was optimized by sequentially removing in a step-by-step fashion 10 variables, with the model rerun until only the three most significant predictors remained. The final optimized model (FOM) has the following non-climatic predictors in order of importance: forest area dynamics (t value: − 11.11; p value: 0.012(1.20%); R: − 0.5), wood fuel (t value: − 9.40; p value: 0.032(3.16%); R: 0.3) and tractors used (t value: 8.46; p value: 0.041(4.09%); R: 0.2). The correlation coefficients obtained for the three most important predictors are also consistent: forest area dynamics has the highest correlation coefficient of about ~ − 50%, wood fuel record ~ 30% and tractors ~ 20% (Additional file 2: Table S2a and Fig. S2a). The FOM is more significant than the IM with a higher f-statistic of 50. The t and p values of this model are also consistent as the most important predictor of crop yields (forest area) has the highest t value and the lowest p value (Table 2). With these results, H1 hypothesis that states that some predictors of crop yields are more important than others in Uganda is valid, while H0 is rejected.
While climatic predictors are found to be of limited statistical importance when compared to the non-climatic predictors, a model of how the 3 climatic variables perform among themselves shows that temperature is the most important climatic predictor of crop yields in Uganda followed by precipitation and CO2 emissions from forest clearance (Additional file 2: Table S2b); this may vary for individual crops as in the case of maize in which for example precipitation is more important. Mean annual temperature is about 22 °C, while mean annual precipitation ranges between 800 and 1500 mm with wide variation between the north and the south. This can be explained by the fact that there is a large dependence on irrigation for agricultural purposes due to unreliable precipitation, a situation that is even more daunting northwards. According to statistics, irrigation for agricultural purposes is the second most important water withdrawal component in Uganda. The greatest water user in Uganda in 2008 was ‘municipalities’ which withdrew about 328 million m3 (51%) of water, while agriculture was second and it used 259 million m3 (41%), while industries withdrew 50 million m3 [89]. Uganda has a huge irrigation potential with most of the potential still unexploited; the 2011 Irrigation Master Plan classified a total of 567,000 Ha (5070 Km2) of potential irrigation land [89]. Some examples of huge irrigation projects exist around Lake Kyoga basin, the Western Region, the Albert Nile Valley and the Jinja districts on Lake Victoria in the south-east of the country [89].
In addition to the variables considered in this analysis, there are other socio-economic and demographic variables that can affect food production. For example, with a population of ~ 36 million in 2013, Uganda has a population growth rate of 3.26%, a dependency rate of 108%, average annual income of 303, 700 Uganda Shillings (UGX) and a literacy rate of 69.6% [90]. Unfortunately, due to the absence of long-term time series and established standardized reliable data on these variables at national scale, it is not possible to use them in our computations.
Agents, location, products, methods of production and markets of key drivers of crop yields in Uganda
In this section, an analysis of the agents, location, products, method of production and markets of the main drivers of crop yields in Uganda is performed. This will help identify and further understand the elements that shape crop production in Uganda.
Forest area
Based on our analysis, forest area is the most important determinant of crop yields in Uganda. The p value of 0.012 or 1.2% shows that the chances of having observations that will differ from the current results are lowest among all the results as there is only a 1.2% chance of having a different observation. The low probabilities for changes depict generally a more reliable model. When the rate of decline in forest area is high, crop yields rise in the short term because of the availability of more land for cultivation, but in the long term reduced SOC and SON will go a long way to contribute to reduced crop yields due to reduced forest area. The farms will also become exposed to erosion. Due to high demand for more land from agriculture, an amount of 88,150 Ha or 1.86% of forest was lost annually during the period 1990–2010 [51]. Uganda experienced a total forest area growth between 51,000 and 2,988,000 Ha of planted trees during the last 2 and a half decade. About 462 tons of carbon is stored in 1 Ha of forest [51]. The agents here include the population of Uganda (~ 36 m) and foreign companies. In terms of location or spatial analysis, most of the forest in Uganda are found in three key areas which are the eastern shoulders of the East African Rift valley, the northern shores of Lake Victoria and isolated montane forests in the north and east. However, pockets of forest can also be found in the north due to an ongoing reforestation drive. Forests are mainly in three key areas of the south-west and east which are: the west including the eastern shoulders of the rift valley, the northern shores of Lake Victoria and around isolated montane forests in the north and east [52]. The key products are: wood fuel, pulp, timber and lumber. The methods of exploitation are either small scale, large scale, manual or mechanized, while the products are either sold nationally or internationally within East Africa and Europe (Table 3).
Uganda’s forest is declining at a significant rate (between 1990 and 2010, a total of about 88,150 Ha or 1.86% of Ugandan forest were lost yearly) [51]. At this rate, the landscape will experience not only increased soil erosion, reduced SOC and SON but also an increased amount of atmospheric carbon. At the above rate of deforestation, a total of 40,725,300 tons of carbon stock (Ha/year) will be lost to the atmosphere (business as usual BAU assuming 462 tons of carbon is lost per Ha). Several scenarios starting with a 75% reduction in deforestation (22,037.5 Ha/year) show lower mean carbon emissions and higher SOC and SON. However, as we move to other scenarios (50, and 25%), the amount of forest lost increases and the carbon emissions also increase, and SOC and SON tend to reduce with increased deforestation (Fig. 4). In general, it can be said that the lower the rate of deforestation, the lower the amount of carbon emissions and the higher the SOC and SON.

Relationship between annual forests lost, carbon emissions and soil organic carbon and nitrogen
Wood fuel
In most African countries including Uganda, wood fuel is the most important source of energy and most of the people use it for domestic and small-scale industrial purposes. The p value of 0.032 or 3.16% shows that there is a 3.16% chance of having observations that will differ from the current. The low probabilities for changes depict generally a reliable model. Charcoal, a derivative of wood fuel, is mostly used in urban areas. Due to persistent energy crisis in Uganda, the demand and consumption of wood fuel in Uganda is estimated at a rate of 3%/year [53,54,55,56]. In Uganda, wood fuel collection is practised by about 70–80% of the local population and over 90% of energy used for domestic activities is obtained from wood fuel in the form of firewood and charcoal [54, 55, 57,58,59,60]. In terms of location or spatial analysis, the main areas of gathering are within the rural areas and urban outskirts in the south-west, east and around isolated forest patches in the north and north-east. In terms of products, firewood, charcoal, wood pellets, wood ash, production of bricks and tiles, are the most common products of wood fuel [56]. The methods of extraction are either small or large-scale, manual or mechanized with the use of chain saws. The products are sold and used locally and nationally (Table 3). The north and north-east of the country are essentially grasslands, but one can find pockets of forest due to current reforestation efforts in this fragile ecoregion. Increased gathering of wood fuel increases deforestation and atmospheric CO2 and thereby reduces SOC and SON while also exposing the soil to erosion and consequently reducing crop yields [61].
Tractors
Mechanization plays an important role in enhancing crop yields globally [41]. Here, a p value of 0.041 or about 4.095% depicts a 4.095% chance of having an observation that is different from the current. The low probabilities for changes depict generally a reliable model. In Uganda, they constitute the third most important non-climatic determinant of crop yields. In terms of agents, in 2014, Uganda had more than 4000 agricultural tractors. As concerns location or spatial analysis, tractors are used all over the country. They are used mainly to harvest, plant, till the soil and to transport crops. The tractors used in Uganda are essentially manufactured by foreign companies (Table 3). The significance of tractors as major elements of agricultural intensification and yield increase is seen as they enhance the entire production process by making tillage, sowing, harvesting and transportation relatively easier than human labour and thereby enhancing crop yields.
Discussion
Forest area, wood fuel and tractors have varying effects on crop yields in SSA
A common way of increasing crop yields in SSA is through farmland expansion by deforestation; in the short term this increases crop yields since more land is brought under cultivation [62,63,64,65]. With the current trends of declining forest due to deforestation for further expansion of farmlands and wood fuel gathering (Additional file 2: Fig. S2a), farms will be exposed to soil erosion and decline in crop yields; this has been illustrated in the ability of forest ecosystems to reduce soil erosion and to maintain and supply SOC and SON. In the longer term, the inputs from the leaves of plants can increase soil aeration and enhance SOC and SON and consequently increase crop yields [61].
The use of tractors has the potential of increasing crop yields in Uganda as in other parts of the world (Additional file 2: Fig. S2a). Increased mechanization would lead to increased food production, improved land use, enhanced rural prosperity and greater exports and less reliance on imports [16, 45]. In 1798, Malthus advocated the principle of preventive checks in his book, ‘An Essay on the principle of population’. Today, these preventive checks may include investments that would prevent famine and subsequent population decline. Examples of such checks in today’s world would include machines and fertilizers that would enhance productivity [63]. In the rest of Africa, it has been argued that mechanization of agriculture is either facing stagnation or retrogression [16, 66]. The causes of this are the absence of effective strategies and policies to enhance investments in tractors and other farm inputs such as irrigation equipments and absence of coordination between governments and private sector [16, 45]. On the negative side, the expansion in the use of tractors recorded in Uganda may be responsible for some of the deforestation in Uganda as reflected by a rapidly declining forest area; this is linked to the relative ease with which mechanized agriculture can enhance forest clearance.
Non-climatic factors are the main drivers of crop yields in most of sub-Saharan Africa
It is expected that declining crop yields in most of SSA are strongly linked to declining precipitation. However, SSA seems to have experienced a relative increase in precipitation from the 1990s [67, 68]. The evidence that precipitation has increased in SSA heralds the argument that non-climatic factors can better explain the yield trends observed in most of SSA. This view point seems to be tenable since the SSA is a zone of sharp seasonal contrast with fluctuations in precipitation at interannual and decadal scales. This makes SSA to be considered further as a region of climatic variability. As such, the observed increase in precipitation does not come with lots of doubt. In fact, the key issue here is that the increased precipitation is often not properly distributed within the growing season and within crop production areas [68].
SSA experienced declining precipitation between the 1950s and early 1980s. However, from the 1990s, trends of an increase in precipitation in most parts of the Sahel and SSA have been recorded [69]. While projections indicate that by 2020, food shortages would have reduced in most developing countries, the Sahel and SSA will still be facing problems with food shortages due to inappropriate land uses such as deforestation, over-cultivation, cattle stock rearing, rapid population growth and inadequate precipitation during the crop growing seasons [70]. Even if crop yields are projected to rise in SSA, it is possible that due to the envisaged increase in population the growth in production will be worthless and the amount of malnourished children will keep on a pessimistic turn towards 2020 [70, 71].
The question is, are there any other studies that support the argument that the influence of climatic drivers such as precipitation on crop yields is declining? In the affirmative, several studies have argued in support of this assertion [72,73,74]. In fact, it has been discussed that agricultural production has declined in Africa due mainly to land use and cover change [62, 75]. Land cover changes through deforestation have repercussions on crop yields, and this can be linked to over-grazing and population pressure on dry land [76]. Stephenne and Lambin [77] also support the above statement when they argue that land cover changes through anthropogenic deforestation, cattle rearing and population growth are responsible for grain declines in the Sahel. It has also been argued that due to an increase in precipitation in the West African Sahel, the role of precipitation as a primary and sole driver of environmental change is now questionable because land use changes are increasingly becoming more important [89]. In India, Nepal and Bangladesh, it has been observed that in terms of changes in farming practices (proxy for adaptation) a majority of farmers responded to market-related drivers than climatic stressors [91]. Market-related variables such as yield and better market opportunities and resource-related variables such as declining fertility and labour have been stronger drivers of change compared to climatic drivers [92].
Adaptation options to enhance crop yields based on the drivers of crop yields
Based on the three most important drivers of crop yields identified, a number of adaptation options can be designed to meet the twin challenges of increasing crop yields and maintaining a sustainable environment (see Fig. 5).

Specific non-climatic adaptations to enhance crop yields in Uganda
Forest area adaptations
Forest area loss is the most important determinant of crop yields in Uganda. To moderate this, the establishment of quotas could be used to restrict logging for commercial and agricultural purposes. This involves establishing a limit beyond which farmers and commercial logging companies are not expected to exceed. The quotas could be in hectares or number of trees that each farmer or company can cut within a year. For this to be successful, the current inventory of forest stock available must be known and all monitoring and reporting systems strengthened, including tackling persistent challenges with corruption. To be effective, monitoring must be shared between officials and the local population to establish ownership and improve compliance. To handle cases of non-compliance, heavy and well-documented and defined financial penalties should be levied. Non-compliance can also be handled through the suspension of licences in the case of commercial logging companies [78]. One way of enhancing compliance could be by enforcing mechanisms like the Reduction of Emissions from Deforestation and Forest Degradation (REDD+) in which farmers and companies that use less of their deforestation quotas get compensated. In the forest zones of the south-west and east of Uganda where most of the people depend on deforestation either to expand agricultural land or for energy, livelihoods can be diversified through the introduction of small-scale businesses, harnessing of local resources, such as medicinal herbs/plants, gathering of fruits, mushrooms, hunting and bee keeping. In addition, the pressure on the forests could be further reduced through investments in renewable energies such as solar, wind and geothermal energies [81]. For these to be successful, governments have to create safety nets through commitments to invest in these sectors as it is the case with biofuels in Brazil [79, 80]. According to Angelson [81], most East African governments are beginning to invest in renewable energies.
Wood fuel adaptations
To be able to restrict the over-exploitation of forests for wood fuel, strict enforcement of quotas in which limits of exploitation are set needs to be observed [78]. Exploiters that exceed their quotas will be liable to pay penalties for non-compliance. Those that are dependent on wood fuel as a source of energy and income will require a diversification of livelihoods through renewable energies such as solar, wind and geothermal and the enhancement of access to new livelihood options such as small-scale businesses, harnessing of local resources, such as medicinal herbs/plants, gathering of fruits, mushrooms, hunting and bee keeping [78, 82,83,84]. Again, just as in the case of forests, the government needs to establish the required safety nets to make sure that the populations can have access to these alternatives.
Tractors/mechanization adaptations
In Uganda, the surge in the use of tractors has positive effects on crop yields. Further approaches have to be identified towards making this accessible to the people. In a country in which most agriculture is in the hands of small-scale farmers, the question that comes up is, how can these farmers can gain access if not ownership of such heavy capital equipments? The importance of agricultural equipment on crop yields has historical origins.
In most of SSA, humans still constitute the principal source of power and farm labour, cultivating about ~ 10% of the total area with tractors and 65% of the total area with draught animals [85,86,87,88]. In Asia, ~ 30% of the land is cultivated by hand, 30% by draught animals and ~ 40% by tractors. In North Africa and the Middle East, ~ 20% of the land is cultivated by hand and another 20% by draught animals, while tractors cultivate about ~ 60% of the land (Clarke and Bishop 2005; Sims et al. 2007). Latin America and the Caribbean also have a well-established record of use of tractors [85,86,87,88]. Within SSA, there is a variation in the use of mechanization with manual power being dominant in central Africa (~ 85%), draught animals being dominant in East Africa (~ 32%) and tractors being dominant in southern Africa (~ 25%).
More recent use of tractors in Africa began in the 1940s. They were first used in commercial white-owned farms, but they spread through tractor hire schemes for small-scale farmers through aid programmes, donor countries and tractor manufacturers before governments came in to support. So by the 1960, several tractorization schemes had been established. At independence of most African countries in 1961, the number of tractors in SSA (172,000 units) exceeded that of Asia (120,000 units). Ten years later in 1971, the number of tractors in Asia had exceeded those in Africa fivefold to 600,000 units and to 6 million units by 2000. During the same period, in SSA, the number of tractors increased slowly and peaked to 275,000 units in 1990 and declined to 221,000 units in 2000. The increase in the use of tractors in Asia illustrates the effects of the green revolution which triggered increased demand for farm power [85,86,87,88].
For such small-scale holders in Uganda, small tractors could be made available at various community extension agricultural centres. The farmers that need such tractors could ask the extension services that will either train the farmers on how to use the equipments or an official might come to the farmers’ farms to perform the task for a fee. Farmers could also form cooperatives through which they can come together and purchase tractors. For the larger-scale farmers, the governments could still help them get the tractors through low interest loans that they will be expected to pay over a given period of time. This should be based on a careful evaluation of the farmers’ assets. Care should be taken to distinguish between large-scale and small-scale farmers to avoid forcing small-scale farmers who are often poor from trying to own tractors they might never be able to pay for and whose profitability is low owing to the amount of land under cultivation.
At independence, most governments in SSA promoted the use of tractors in an effort to meet up with increased demand for food and cash crops. This was achieved through government run tractor hire schemes. Here commercial banks provided soft loans at low interest rates, while farmer groups and cooperatives were encouraged to purchase tractors. This resulted in an increase in the use of tractors at independence. However, this system soon started failing due to poor economic performance, weak infrastructure and poor management. Under the government tractor hire scheme, the areas cultivated per hectare per machine were small and the cost to run the machines was fixed [86,87,88] as such much was spent and little gains were made; the schemes were bound to fail. Therefore, if the tractorization programme in Uganda has to be successful, the area under cultivation has to be taken into consideration to avoid these weaknesses as well as avoid a system that lacks the basic infrastructure to support machines. A scheme that is entirely subsidy driven, poorly maintained, expensive to repair machines and difficult in obtaining spare parts should be avoided.
Conclusions
This paper examines the drivers of crop yields in Uganda, identifying non-climatic factors—primarily forest area, wood fuel, and tractors—to be more important than climatic factors in determining crop yields. These results are consistent with what currently obtains in most of SSA as most of the literature argues that precipitation in Africa is currently increasing but not properly distributed across the growing seasons. As a result, precipitation decline during crop growing seasons has only come to make a bad situation worse due to land use dynamics such as forest area loss, wood fuel dynamics and agricultural inputs such as tractors have emerged to be more significant. The systematic approach is a context-specific approach that argues that it is wrong to up-lift policies that have worked elsewhere and apply them in other areas; like most climate smart agricultural approaches, the right approach is to base policies and adaptations on the actual drivers of the problem that is under investigation.
In terms of specific policies, forest area dynamics and fuel wood gathering could be controlled through: establishment of quotas, renewable energies, penalties and enforcement, and diversification of livelihoods. In terms of tractors, large-scale farmers could get low interest loans to purchase tractors, while small-scale farmers could benefit by forming cooperatives that can buy the tractors or extension services could be put in place by the government to enhance access to these services. It is however suggested that, since this study is based on large-scale national-level data for the whole of Uganda, further experiments should be carried out touching on specific districts based on the perceptions of farmers. Also, the response of individual crops to these variables should be verified including the possible future outcomes. Data on the influence of market demand on food production from specific sites across Uganda and other SSA countries could be obtained from population perceptions based on household surveys. Studies such as Bhatta et al. [91, 92] have used this approach. The latter is necessary because for Uganda and other SSA countries, there exist very limited long-term reliable time series data on market demand. It is for this reason that for this national scale study, time series population trends have been used as a proxy for national-level market demand or food needs in Uganda. This is valid as in any country; population numbers exert pressure on food production and thereby control demand.
References
International Assessment of Agricultural Knowledge (IAASTD). Agriculture at a crossroads. Global report Chs 1, 4. Island Press. 2009. http://www.agassessment.org/reports/IAASTD/EN/Agriculture at a Crossroads Global Report (English).
The Royal Society. Reaping the benefits: science and the sustainable intensification of global agriculture 1–10, 47–50 (The Royal Society). 2009. http://royalsociety.org/.
Foley JA, Ramankutty N, Brauman KA, Cassidy E, Greber J, Johnston M, Mueller ND, O’Connell C, Ray DK, West PC, Balzer C, Bennett EM, Carpenter SR, Hill J, Monfredo C, Polasky S, Rockstrom J, Sheehan J, Siebert S, Tilman D, Zaks DPM. Solutions for a cultivated planet. Nature. 2011;478:337–478. https://doi.org/10.1038/nature10452.
Kearney J. Food consumption trends and drivers. Philos Trans R Soc B. 2010;365:2793–807.
Cirera X, Masset E. Income distribution trends and future food demand. Philos Trans R Soc B. 2010;365:2821–34.
Tester M, Langridge P. Breeding technologies to increase crop production in a changing world. Science. 2010;327:818–22.
Sanchez PA. Tripling crop yields in tropical Africa. Nat Geosci. 2010;3:299–300.
DeFries RS, Rudel T, Uriarte M, Hansen M. Deforestation driven by urban population growth and agricultural trade in the twenty-first century. Nat Geosci. 2010;3:178–81.
Lobell DB, Schlenker W, Costa-Roberts J. Climate trends and global crop production since 1980. Science. 2011;333(6042):616–20.
Naylor R. Expanding the boundaries of agricultural development. Food Secur. 2011;3:233–51.
Schmidhuber J, Tubiello FN. Global food security under climate change. PNAS. 2007;104:19703–8.
Food and Agriculture Organization of the United Nations (FAO). The State of Food Insecurity in the World: Economic crises—Impacts and lessons learned 8–12, FAO, Rome, Italy. 2009. http://www.fao.org/3/a-i0876e.pdf.
Thurow R, Kilman S. Enough: why the world’s poorest starve in an age of plenty Chs 2, 4, 12. New York: Perseus Books; 2009.
Battisti DS, Naylor RL. Historical warnings of future food insecurity with unprecedented seasonal heat. Science. 2009;2009(323):240–4.
Moss RH, Edmonds JA, Hibbard KA, Manning MR, Rose SK, van Vuuren DP, Carter TR, Emori S, Kainum M, Kram T, Meehl GA, Mitchell JFB, Nakicenovic N, Riahi K, Smith SJ, Stouffer RJ, Thomson AM, Weyant JP, Wilbanks TJ. The next generation of scenarios for climate change research and assessment. Nature. 2010;463:747–56. https://doi.org/10.1038/nature08823.
Food and Agricultural Organization of the United Nations Statistics Division (FAO) and United Nations Industrial Development Organization (UNIDO). Agricultural mechanization in Africa…Time for action. Planning investment for enhanced agricultural productivity report of an expert group meeting in January 2008, Vienna Austria. FAO, Rome. 2008. http://www.unido.org/fileadmin/user_media/Publications/Pub_free/agricultural_mechanization_in_Africa.pdf.
Lobell DB, Cassman KG, Field CB. Crop yield gaps: their importance, magnitudes and causes. Ann Rev Environ Resour. 2009;34:179–204.
Negin J, Remans R, Karuti S, Fanzo JC. Integrating a boarder notion of food security and gender empowerment into the African green revolution. Food Secur. 2009;1:351–60.
Denning G, Kabambe P, Sanchez P, Malik A, Flor R, Harawa R, Nkhoma P, Zambia C, Banda Magombo C. Inputs subsidies to improve smallholder maize productivity in Malawi: towards an African green revolution. PLoS Biol. 2009;7:e1000023.
Kaizzi K. Application of the GYGA approach to Uganda. Uganda. 2014. http://www.yieldgap.org/gygamaps/excel/GygaUganda.xlsx.
Poate CD. A review of methods for measuring crop production from small-holder producers. Exp Agric. 1988;24:1–14.
IFAD. Enabling poor rural people to overcome poverty in Uganda: rural poverty in Uganda. Rome, Italy. 2012. www.ifad.org.
Mubiru DN, Kyazze FB, Radeny M, Zziwa A, Lwasa J, Kinyangi J. Climatic trends, risk perceptions and coping strategies of smallholder farmers in rural Uganda. CCAFS Working Paper no. 121. CGIAR Research Program on Climate Change, Agriculture and Food Security (CCAFS). Copenhagen, Denmark. 2015. www.ccafs.cgiar.org.
Mubiru J, Banda EJKB. Monthly average daily global irradiation map for Uganda. A location in the equatorial region. Renew Energy. 2012;41:412–5.
Farley C, Farmer A. Uganda climate change vulnerability report. USAID. 2013. http://community.eldis.org/.5b9bfce3/ARCC-Uganda%20VA-Report.pdf.
Government of Uganda, Ministry of Water and Environment. 2008 Inception Report: climate change vulnerability assessment, adaptation strategy and action plan for the water resources sector in Uganda. One World Sustainable Investments. Directorate of Water Resource Management. 2008.
Food and Agricultural Organization of the United Nations Statistics Division (FAO). FAOSTAT. 2016. http://faostat3.fao.org/download/Q/QC/E.
Epule TE, Peng C, Lepage L, Chen Z. The causes, effects and challenges of Sahelian droughts: a critical review. Reg Envron Change. 2014;14:145–56. https://doi.org/10.1007/s10113-013-0473-z.
Prince SD, Brown De Coulston E, Kravitz LL. Evidence from rain-use efficiencies does not indicate extensive Sahelian desertification. Glob Change Biol. 1998;4:359–74.
Maynard K, Royer JF, Chauvin F. Impact of greenhouse warming on the West African summer monsoon. Clim Dyn. 2002;19:499–514.
Rotstayn LD, Lohmann U. Tropical rainfall trends and the indirect aerosol affect. J Clim. 2002;14:2103–16.
Knutson TR, Delworth TL, Dixon KW, Held IM, Lu J, Ramaswamy V, Schwarzkopf MD, Stenchikov G, Stouffer RJ. Assessment of twenty-century regional surface temperature trends using the GFDL CM2 coupled models. J Clim. 2006;19:1624–51. https://doi.org/10.1175/JCLI3709.1.
McSweeney C, New M, Lizcano G. UNDP climate change country profiles: Uganda. 2010. http://country-profiles.geog.ox.ac.uk/. Accessed 15 Mar 2017.
McSweeney C, New M, Lizcano G, Lu X. The UNDP climate change country profiles improving the accessibility of observed and projected climate information for studies of climate change in developing countries. Bull Am Meteorol Soc. 2010;91:157–66.
Epule TE, Changhui P, Laurent L, Zhi C. Forest loss triggers in Cameroon: a quantitative assessment using multiple linear regression approach. J Geogr Geol. 2011;3(1):30–40.
Epule TE, Changhui P, Laurent L, Zhi C, Nguh BS. The environmental quadruple: forest area, rainfall, CO2 emissions and arable production interactions in Cameroon. Br J Environ Clim Change. 2012;2(1):12–27.
Houghton RA. Tropical deforestation and atmospheric carbon dioxide. Clim Change. 1991;19:99–118.
Mertens B, Lambin E. Spatial modeling of deforestation in southern Cameroon: spatial disaggregation of diverse deforestation processes. Appl Geogr. 1997;17(2):143–62.
Carr D, Suter L, Barbieri A. Population dynamics and tropical deforestation: state of the debate and conceptual challenges. Popul Environ. 2005;27:90–113.
Matson PA, Parton WJ, Power AG, Swift MJ. Agricultural intensification and ecosystem properties. Science. 1997;277:504–9.
Lindell L, Astrom M, Oberg T. Land-use versus natural controls on soil fertility in the Subandean Amazon, Peru. Sci Total Environ. 2010;408(4):965–75.
Epule TE, Bryant CR, Akkari C, Daouda O. Can organic fertilizers set the pace for a greener arable agricultural revolution in Africa? Analysis, synthesis and way forward. Land Use Policy. 2015;47(1):179–87. https://doi.org/10.1016/j.landusepol.2015.01.033.
Matson PA, Naylor R, Ortiz-Monasterio I. Integration of environmental, agronomic, and economic aspects of fertilizer management. Science. 1998;280:112–4.
Yohanna JK, Fulani AU, Akaama W. Survey of mechanization problems of small scale (peasant) Farmers in the middle belt of Nigeria. J Agric Sci. 2011;3(2):262–6.
Yohanna JK. Farm machinery utilization for sustainable agricultural production in Nasarawa State of Nigeria. Int J Food Agric Res. 2007;1&2:193–9.
Muller R, Pistorius T, Rohde S, Gerold G, Pacheco P. Policy options to reduce deforestation based on a systematic approach of drivers and agents in lowland Bolivia. Land use Policy. 2013;30:895–907. https://doi.org/10.1016/j.landusepol.2012.06.019.
Hector A, Schmid B, Beierkuhnlein C, Caldeira C, Diemer M, Dimitrakopoulos PG, Finn JA, Freitas H, Giller PS, Good J, Harris R, Hogberg P, Huss-Danell K, Joshi J, Jumpponen A, Korner C, Leadley PW, Minns A, Mulder PH, Donovan GO, Otway SJ, Pereira JS, Prinz A, Read DJ, Scherer-Lorenzen M, Schulze ED, Siamantziouras ASD, Spehn EM, Terry AC, Troumbis AY, Woodward FI, Yachi S, Lawton JH. Plant diversity and productivity experiments in European grassland. Science. 1999;286(5442):1123–7. https://doi.org/10.1126/science.286.5442.1123.
Neumann K, Verburg PH, Stehfest E, Muller C. The yield gap of global grain production: a spatial analysis. Agric Syst. 2010;103:316–26.
Stanhill G, Cohen S. Global dimming: a review of the evidence for a widespread and significant reduction in global radiation with discussion of its probable causes and possible agricultural consequences. Agric For Meteorol. 2010;107:225–78.
Calderini D, Slafer G. Changes in yield and yield stability in wheat during the 20th century. Field Crops Res. 1998;57:335–47.
Food and Agricultural Organization of the United Nations Statistics Division (FAO). Forest Resource Assessment. FAO Forestry paper no. 163. Rome: FAO; 2010. http://www.fao.org.
Hamilton AC. Distribution patterns of forest trees in Uganda and their historical significance. Vegetation. 1974;29:21–35.
Wood GB, Wiant HV Jr. editors. Modern methods of estimating tree and log volume. In: Proceedings of IUFRO conference, Morgantown, West Virginia, 14–16 June 1993. West Virginia University Publication Services. 1993.
Kohlin G, Amacher G. Welfare implications of community forest plantations in developing countries: the Orissa Social Forestry Project. Am J Agric Econ. 2006;87(4):855–69.
Arnold JEM, Köhlin G, Persson R. Woodfuels, livelihoods, and policy interventions: changing perspectives. World Dev. 2006;34(3):596–611.
Godfrey AJ, Denis K, Daniel W, Akais OC. Household firewood consumption and its dynamics in Kalisizo sub-county, central Uganda. Ethnobot Leaflets. 2010;14:841–55.
DFID. Energy for the poor: underpinning the millennium development goals. London: Department for International Development; 2002. http://www.dfid.gov.uk/Documents/publications/energyforthepoor.pdf.
World Bank. Report of the AFTEG/AFTRS joint seminar on household energy and woodland management. Washington: World Bank; 2002.
Tabuti JRS, Dhilliona SS, Lye KA. Firewood use in Bulamogi County, Uganda: species selection, harvesting and consumption patterns. Biomass Bioenergy. 2003;25:581–96.
Fisher M. Household welfare and forest dependence in Southern Malawi. Environ Dev Econ. 2004;9:135–54.
Dan X, Deng Q, Li M, Wang W, Zhang Q, Cheng X. Reforestation of Pinus massoniana alters soil organic carbon and nitrogen dynamics in eroded soil in south China. Ecol Eng. 2013;52:154–60.
Geist HJ, Lambin EF. Proximate causes and underlying driving forces of tropical deforestation. Bio Sci. 2002;52:143–50.
Rosegrant MW, Cline SA. Global food security: challenges and policies. Science. 2003;302:1917–9.
Zhao S, Peng C, Jiang D, Lei X, Zhou X. Land use change in Asia and ecological consequences. Ecol Res. 2006. https://doi.org/10.1007/s11284-006-0048-2.
Zak RM, Cabido DC, Diaz S. What drives accelerated land cover change in central Argentina? Synergistic consequences of climatic, socioeconomic, and technological Factors. Environ. Manag. 2008;42:181–9.
Kepner RA, Bainer R, Barger EL. Principles of farm machinery. 3rd ed. Westport: AVI Publishing Company, Inc.; 1978.
Eklundh L, Olsson L. Vegetation index trends for the African Sahel 1982–1999. Geophy Res Lett. 2003;30(8):1430. https://doi.org/10.1029/2002GL016772.
Hulme M. Climatic perspective on Sahelian desiccation: 1973–1998. Global Environ Change. 2001;11:19–29.
Wang G, Eltahir AB. Role of vegetation dynamics in enhancing the low-frequency variability of the Sahel rainfall. Water Resour Res. 2000;36(4):1013–21.
International Fund for Agricultural Development (IFAD). The Challenge of ending rural poverty. Rural Poverty Report. 2001. http://www.ifad.org.
Tucker CJ, Nicholson SE. Variations in the size of the Sahara desert from 1980 to 1997. Ambio. 1999;2009(28):587–91.
Herrmann SM, Anyamba A, Tucker CJ. Recent trends in vegetation dynamics in the African Sahel and their relationship to climate. Glob Environ Change. 2005;15:394–404.
Olsson L, Eklundh L, Ardo J. The recent greening of the Sahel-trends, patterns and potential causes. J Arid Environ. 2005;63(3):556–66.
Anyamba A, Tucker CJ. Analysis of Sahelian vegetation dynamics using NOAA-AVHRR NDVI data from 1981–2003. J Arid Environ. 2005;63:595–614.
Ewert F, Rounsevell MDA, Reginster I, Metzger MJ, Leemans R. Future scenarios of European agricultural land use. Estimating the changes in crop productivity. Agric Ecosyst Environ. 2005;107:101–16.
Lambin E, Rounsevell MDA, Geist HJ. Are agricultural land-use models able to predict changes in land-use intensity? Agric Ecosyst Environ. 2000;82:321–31.
Stephenne N, Lambin EF. A dynamic simulation model of land-use changes in Sudano-Sahelian countries of Africa (SALU). Agric Ecosyst Environ. 2001;85:145–61.
Tollefson J. Paying to save the rainforests. Nature. 2009;460:936–7.
Nepstad D, Soares-Filho B, Merry F, Lima A, Moutinho P, Carter J, Bowman M, Cattaneo A, Rodrigues H, Schwartzman S, McGrath DG, Sticker CM, Lubowski R, Piris-Cabezas P, Rivero S, Alencar A, Almeida O, Stella O. The end of deforestation in the Brazilian Amazon. Science. 2009;326(5958):1350–1.
Gunilla E, Olsson A, Outtara S. Opportunities and challenges to capturing the multiple potential benefits of REDD+ in a traditional Savana-Woodland Region in West Africa. Ambio. 2013;42:309–19.
Angelson A. Realising REDD+ : national strategy and policy options. Centre for International Forestry Research, Bogor, Indonesia. 2009. http://www.cifor.org/publications/pdf_files/Books/BAngelsen0902.pdf.
Mwape C, Gumbo D. Communities’ reorganization for REDD+ implementation in Zambia. In: Pathways for implementing REDD+. UNEP Perspectives Series2010. 2010. http://cd4cdm.org/Publications/PathwaysImplementingREDDplus.pdf.
Naughton-Treves L, Day C. Lessons about land tenure, forest governance and REDD+: case studies from Africa, Asia and Latin America. Land Tenure Center, UW-Madison. 2012. https://www.nelson.wisc.edu/ltc/docs/Lessons-about-Land-Tenure-Forest-Governance-and-REDD.pdf.
Brockhaus M, Obidzinski K, Dermawan A, Laumonier Y, Luttrell C. An overview of forest and land allocation policies in Indonesia: is the current frame-work sufficient to meet the needs of REDD+? For Policy Econ. 2012;18:30–7.
Winrock AK. Assessment of animal agriculture in sub-Saharan Africa. Little Rock: Winrock International; 1992.
Clarke L, Bishop C. Farm power-present and future availability in developing countries. Agricultural Engineering International: the CIGR Journal of Scientific Research and Development. Invited Overview Paper. Presented at the Special Session on Agricultural Engineering and International Development in the Third Millennium. ASAE Annual International Meeting/CIGR World Congress, 30 July 2002, Chicago, IL. USA. vol. IV. 2002. https://ecommons.cornell.edu/bitstream/handle/1813/121/Clarke%20and%20Bishop%2018aOct2002.pdf?sequence=17.
Sims BG, Kienzie J, Cuevas R, Wall G. Addressing the challenges facing agricultural mechanization input supply and farm product processing. In: Proceedings of an FAO workshop held at the CIGR world congress on agricultural engineering Bonn, Germany, 5–6 Sept 2006. FAO, Rome, Italy. 2007. ftp://ftp.fao.org/docrep/fao/010/a1249e/a1249e.pdf.
Yohanna JK. An appraisal of farm power and equipment operation and management in Nasarawa State of Nigeria. J Eng Sci Technol. 2006;1(1):58–61.
FAO. AQUASTAT. FAO. 2015. http://www.fao.org/nr/water/aquastat/countries_regions/UGA/.
Uganda Bureau of Statistics, UBOS. Uganda national household survey findings 2009/2010. 2010. http://www.ubos.org/UNHS0910/chapter2_introduction.html Accessed 7 March 2017.
Bhatta GD, Aggarwal PK, Shrivastava AK, Sproule L. Is rainfall gradient a factor of livelihood diversification? Empirical evidence from around climatic hotspots in Indo-Gangetic plains. Environ Dev Sustain. 2016;18:1657–78.
Bhatta GD, Aggarwal PK, Kristjanson P, Shrivastava AK. Climate and non-climatic factors influencing changing agricultural practices across different rainfall regimes in South Asia. Curr Sci. 2016;110:7.
Sarker MA, Alam K, Gow J. Exploring the relationship between climate change and rice yield in Bangladesh: an analysis of time series data. Agric Syst. 2012;112:11–6.
Lobell DB, Field CB. Global climate crop yield relationships and the impacts of recent warming. Eviron Res Lett. 2007;2(1–7):014002.
Schlenker W, Lobell DB. Robust negative impacts of climate change on African agriculture. Envion Res Lett. 2010;5(1–8):014010.
Mulatu DW, Eshete ZS, Gatiso RG. The impact of CO2 emissions on agricultural productivity and household welfare in Ethiopia. Environ. For Dev. Discussion paper Series; 2016. http://www.efdinitiative.org/sites/default/files/publications/efd-dp-16-08.pdf.
Jaggard K, Qi A, Ober ES. Possible change to arable crop yields by 2050. Philos Trans R Soc B. 2010;365:2835–51.
Authors’ contributions
TEE collected the data, performed the analysis and wrote the paper. JF is the postdoctoral advisor of TEE, he had extensive discussions with TEE on the design and elaboration of the paper, and he also participated in writing and editing the paper and supervised the entire study. SL had discussions with TEE. BN and AB were field assistants during Dr. Epule’s field visit to Karamoja, north-east Uganda, and thus assisted in conducting interviews and culling other data. All authors read and approved the final manuscript.
Acknowledgements
We wish to thank the authors whose works we consulted and the University of Oxford, the UNDP and FAO for providing the data used in this study.
Competing interests
The authors declare no conflict of interests.
Availability of data and materials
Please contact corresponding author for data requests.
Consent for publication
Not applicable.
Ethics approval and consent to participate
Not applicable.
Funding
This work was supported by a Grant from the Social Science and Humanities Research Council of Canada Grant Number 756-2016-0003.
Publisher’s Note
Springer Nature remains neutral with regard to jurisdictional claims in published maps and institutional affiliations.
Author information
Authors and Affiliations
Corresponding author
Additional files
Additional file 1.
Table S1. Summary of 31 food and cash crops used in this study and all other data in excel
Additional file 2.
Table S2a. Correlation matrix and summary of variables used in this study and their sources. Table S2b. Outputs of the optimized regression model based on the 3 most significant climatic variables. Figure S2a. Scatter plots of (a): forest area and yield; (b): wood fuel and yield; (c) agricultural tractors and yield.
Rights and permissions
Open Access This article is distributed under the terms of the Creative Commons Attribution 4.0 International License (http://creativecommons.org/licenses/by/4.0/), which permits unrestricted use, distribution, and reproduction in any medium, provided you give appropriate credit to the original author(s) and the source, provide a link to the Creative Commons license, and indicate if changes were made. The Creative Commons Public Domain Dedication waiver (http://creativecommons.org/publicdomain/zero/1.0/) applies to the data made available in this article, unless otherwise stated.
About this article

Cite this article
Epule, T.E., Ford, J.D., Lwasa, S. et al. The determinants of crop yields in Uganda: what is the role of climatic and non-climatic factors?. Agric & Food Secur 7, 10 (2018). https://doi.org/10.1186/s40066-018-0159-3
Received:
Accepted:
Published:
DOI: https://doi.org/10.1186/s40066-018-0159-3